
The Dashboard Screen
A dashboard has one calm top bar and a grid of cards. This page explains what each part shows and where each action is.

The Top Bar
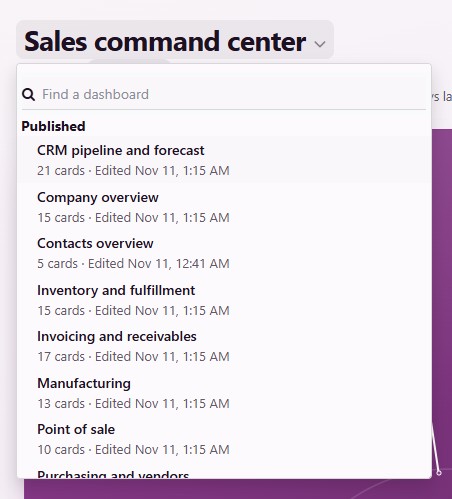
The dashboard’s name: Click it to switch to another dashboard. The list groups every dashboard you can open into Bookmarked, Published, My drafts and Other drafts, each with its owner, its number of cards and when it was last edited.
Under the name: The company, Private draft or Published, and when the numbers were Updated. The arrow beside it refreshes them.
The summary line: One line that sums the dashboard up from its own numbers, for example the list with the most late records and the number cards that moved the most.
The period chip: The period every card shows, such as Year to date, with Compare beside it. See Periods and Comparison.
Filters and Only mine, on dashboards that have them. See Filters and Only Mine.
Edit, when the dashboard is your own draft. See Edit the Dashboard.
⋯: The dashboard’s menu.
Times read in your Odoo time zone. When your browser is in another zone, the time names its zone.
The Dashboard Menu
The ⋯ menu at the top right holds:
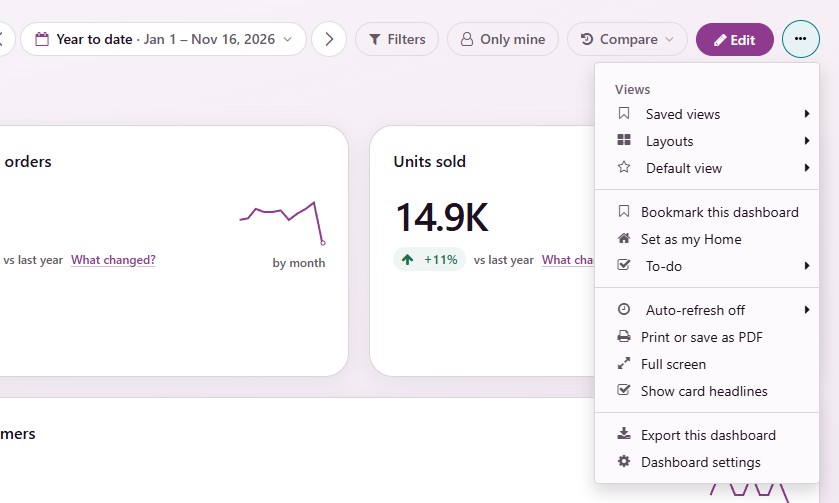
Saved views, Layouts and Default view. See Saved Views and Layouts.
Bookmark this dashboard and Set as my Home. See My Home and Today.
To-do: Your own list for this dashboard. See Your To-Do List.
Auto-refresh off, Print or save as PDF and Full screen. See Downloads, PDF, Full Screen and Refresh.
Show card headlines: Switches the one-line headlines and the summary line off or on for this dashboard, remembered in this browser.
For the owner: Export this dashboard and Dashboard settings. See Export and Import Dashboards and Dashboard Settings.
Cards
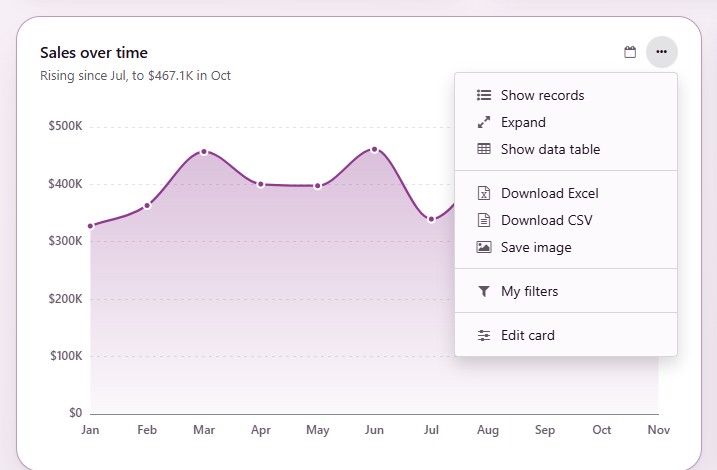
A card’s header is one row: its title, its period and its own ⋯ menu. A card that keeps a period of its own names it in a small chip, such as Last month. With a mouse, the card’s tools appear when you point at the card or reach it with Tab. On a touch screen they always show.
The card menu holds:
Show records: Opens the records behind the card. See Records Behind the Numbers.
Expand: Shows the card large, with its values written on the bars and slices, its data table and its downloads. Esc returns to the card.
Show data table: Shows the numbers of a chart as a table. The same entry switches back.
Download Excel, Download CSV and Save image. See Downloads, PDF, Full Screen and Refresh.
How it’s calculated. See How It’s Calculated.
My filters. See Filters and Only Mine.
Edit card, on your own draft.
Number Cards
A number card shows the value, its change as a colored pill and a small line of how it moved.
Green is good news, red is bad news and gray has no judgment. More credit notes, for example, show in red.
The pill says what it is compared with: vs last year or vs previous period. Point at it, or tap it on a phone, to read both date ranges with both numbers.
When a period is not over yet, the change compares its days so far and the pill says vs same days last year or vs same days, previous period.
A number that rose from almost nothing reads Up from and the earlier amount instead of a huge percentage. When there was nothing before, the card shows a gray New.
The line picks its own step so it always has points to draw: by day, by week, by month or by year.
Lists and Charts
A list card says how many records match, such as 35 orders · See all, and shows the whole records that fit the card. A line such as First 7 by Expected Closing, earliest first. says which ones it shows.
A list with nothing in it is one line with a check mark that says what is empty, such as No quotations to follow up, and a link to the app’s own list.
Under a chart’s title, one sentence says what its numbers show, such as Marc Demo has the biggest share: 42% of the total. When the numbers cannot prove a statement, there is no sentence.
A card that shows how things stand now (quotations waiting, unpaid invoices, units on hand) says Right now instead of a period: the dashboard’s period does not change it.
No card ever scrolls. When rows or columns do not fit, the foot of the card says what is left, such as 8 more rows · Expand.
How Numbers Read
Money reads in the dashboard company’s currency, short from 1,000 up ($381.5K). Point at a number for the exact amount. An amount in another currency also names its code.
Counts are whole numbers. A change reads +6.1% below 10% and +388% from 10% up.
Status colors mean the same on every chart: green for done, blue for not started or ready, amber for held up and gray for stopped.
Your To-Do List
Every dashboard has a To-do list in its ⋯ menu. Write down what you mean to do after reading the dashboard, such as “Call the Brussels team”, tick it off when done and clear the finished ones. The list belongs to you and this dashboard; nobody else sees it.