
What Changed?
What changed? explains a number’s change: which customers, products and people made it rise or fall. It is plain arithmetic on your own data, so it gives the same answer every time.
Open What Changed?
On a number card that shows its change, such as +6.06% vs last year:
Click What changed? beside the change, or choose it in the card’s ⋯ menu.
A panel opens (a sheet from the bottom on a phone).
What the Panel Shows
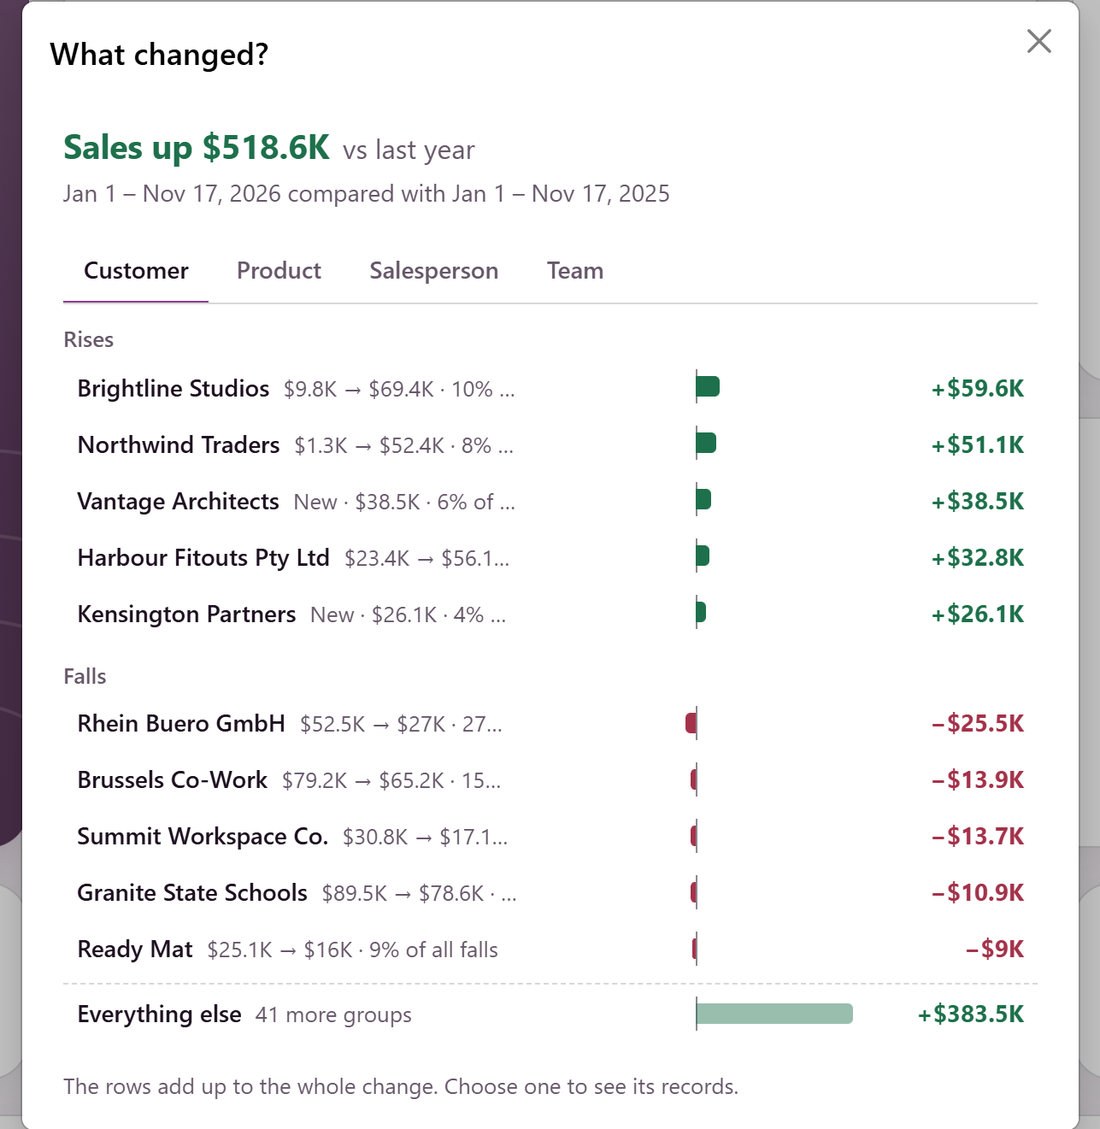
The change in one line, such as Sales up $340.6K vs last year, then both date ranges.
One tab per split the card’s data has: Customer, Product, Salesperson and Team (Vendor and Buyer on purchases).
On each tab, up to five groups that rose the most and up to five that fell the most, biggest first. Each row shows its earlier and current amount, its change as a bar and its part of all the rises or all the falls, such as 75% of all rises.
New marks a group that had nothing before, and None now a group that has nothing now.
Everything else holds the other groups that moved, so the rows always add up to the card’s change.
Click a row to open that group’s records in Odoo’s own list: this period’s records, or the earlier period’s for a group that has none now.
What It Compares
Exactly the two periods the card compares: its own comparison, or the one you chose with Compare. See Periods and Comparison.
The card’s and the dashboard’s filters, and only the records you can see. A customer, product or person you cannot read is never named: its amount stays in Everything else.
It describes what moved, never why.
When It Is Not Offered
A number has no What changed? when it is an average, a lowest or a highest, has no comparison, is zero in both periods, or comes from a ready-made measure. A split with more than 2,000 groups in a period says so instead of guessing.