
Choose a Chart Type
In the card editor, Chart type (on the Data tab, under the data) is a grid of tiles. Every type is on view at once, each with a small picture of how it looks and its name.
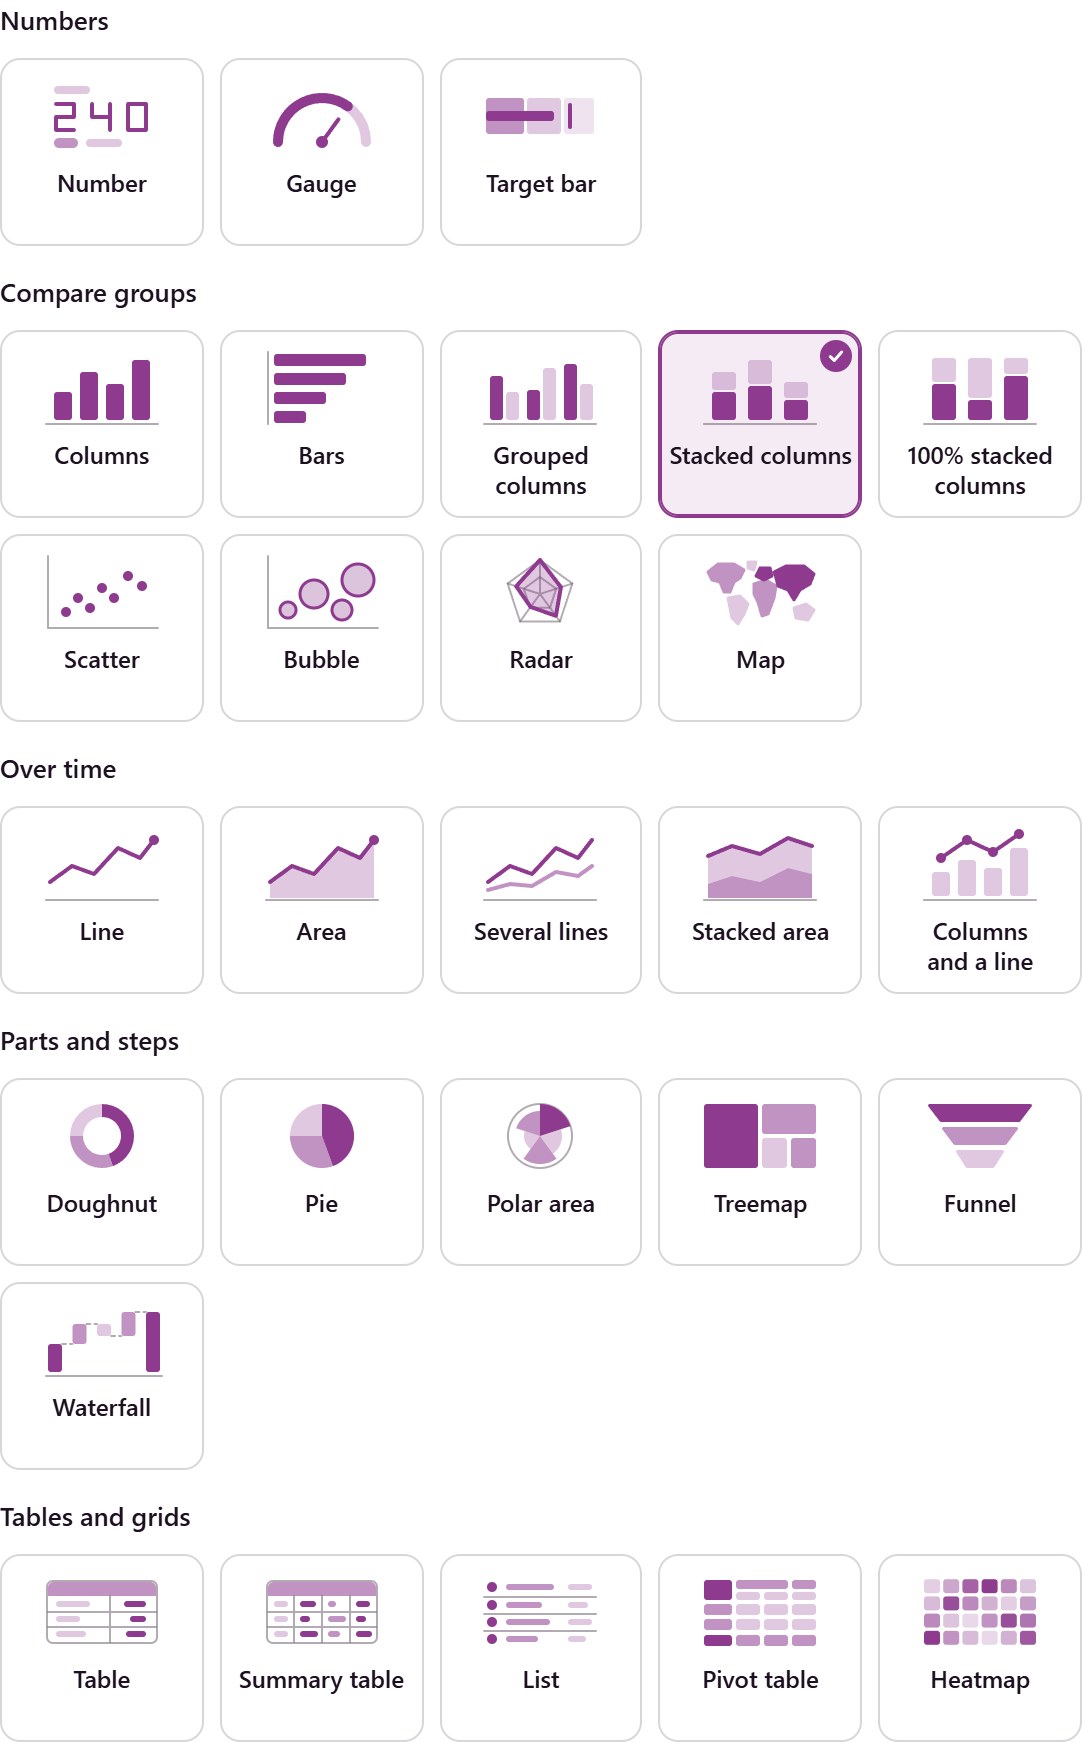
The Chart Types
Heading |
Types |
|---|---|
Numbers |
Number, Gauge, Target bar |
Compare groups |
Columns, bars, grouped, stacked and 100% stacked columns, scatter, bubble, radar and the map |
Over time |
Lines, areas, several lines, stacked area, columns and a line |
Parts and steps |
Doughnut, pie, polar area, treemap, funnel, waterfall |
Tables and grids |
Table, summary table, list, pivot table, heatmap |
Pick a Type
Click a tile, or move with the arrow keys and press Space or Enter. The label then reads, for example, Chart type · Columns, and the line under it says what that type is for.
When the card is not finished for that type, a line under the tiles says what is missing, with a button that takes you there. A Doughnut with no split, for example, says This chart needs something to split by.
A type that cannot be used right now stays on view but dimmed, and a line above the tiles says why. A ready-made measure cannot draw a pivot table, a list or several values: the line offers Any data to switch.
Changing the type drops what the new type cannot use, such as a split by salesperson on a line chart. Switch back and it returns.
The Chart tab shows the type in use with Change chart type.
Maps
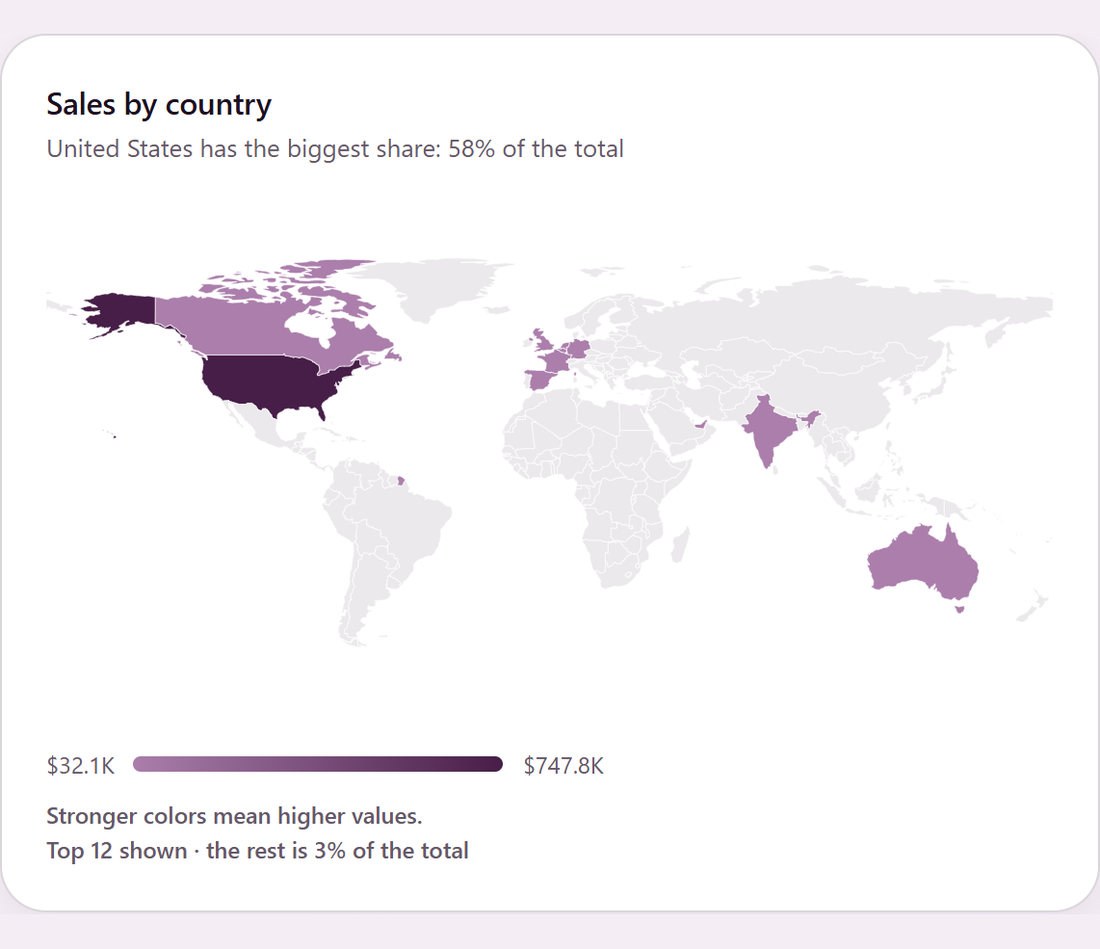
Group a count or total by a country field (a contact’s country, a lead’s country) and the suggestion becomes Map: countries are colored from light to dark by their value. The data table below has every number. The world outline comes from Odoo’s Spreadsheet app; without it the card lists the numbers in ranked order and says why.
Split by Two Things
Pivot tables, heatmaps, grouped and stacked columns, several lines, stacked areas, columns and a line, and tables can split by two fields, such as salesperson and stage, or team and month.
A pivot shows up to 25 rows and 12 columns, a stacked chart up to 12 stacks. When there are more, the biggest are kept and the card says so. Totals always include every record.
A pivot’s Show as turns its numbers into a share of the total, of a row or of a column, or a rank. With date columns it also offers Change from previous and Running total. This changes only what you see, never the saved card.
A name you may not read shows as Name unavailable.
Sorting and the Category Limit
A chart that draws one bar, slice or row per category lists them in the order you choose in Sort Categories By: by the measure (Largest first or Smallest first) or by the name (A to Z or Z to A).
A chart shows only its first categories: the limit is on the Advanced tab. Sort by the measure to show the top salespeople or customers.
When categories are left out, the footer says so, such as Top 10 shown · the rest is 18% of the total. A pie draws the rest as one pale gray Other slice.
Charts over time always run forward and show every month, week or day of the period, with 0 where nothing happened.
Charts That Read True
Bars, columns, areas and stacks always start at zero. Only a line may start elsewhere.
No two categories of a chart share a color while they fit the theme’s colors, and a category keeps its color across cards.
Status colors mean the same everywhere: green for done and paid, blue for draft and ready, amber for waiting and late, gray for cancelled and lost.