
Card Settings
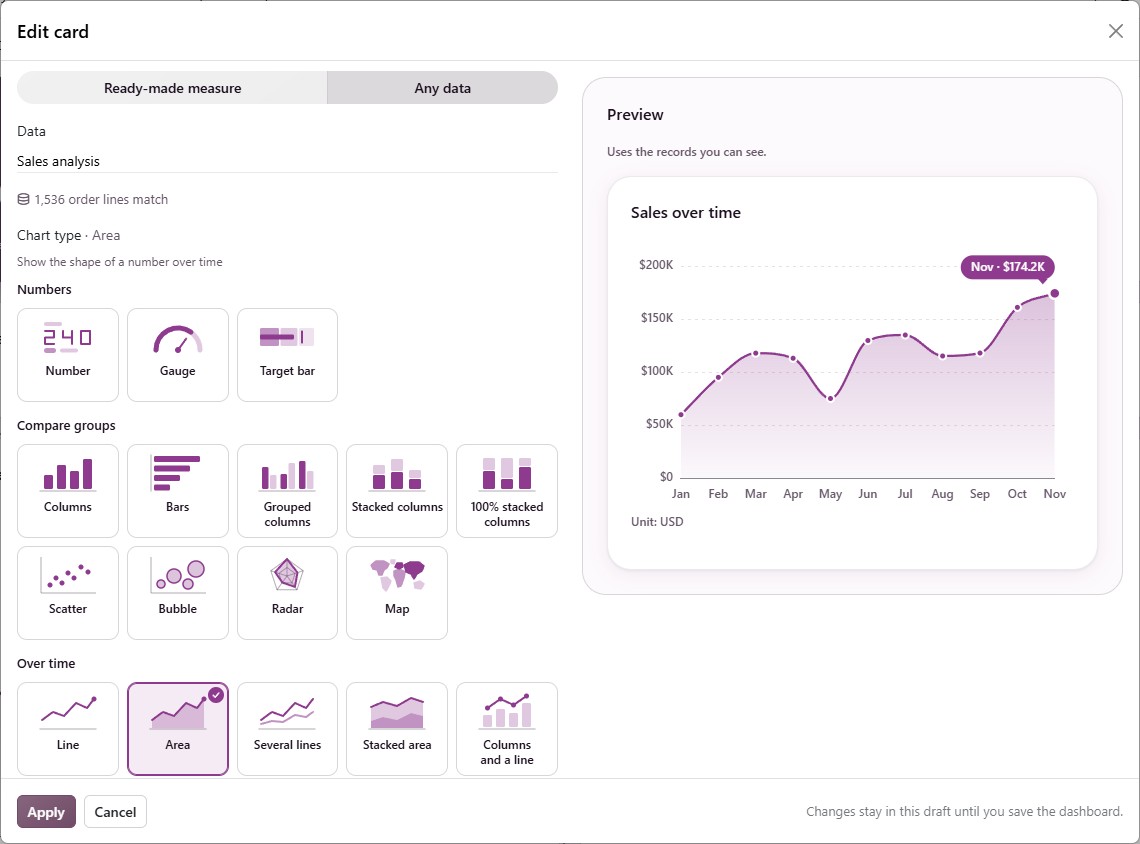
The full card editor sets how a card compares, how it reads, what a click does and who sees it. Open it with Edit card on a card of your draft, or More options… in Add card.
The editor shows the card’s Name and Card color at the top, a live Preview on the right, and five tabs: Data, Chart, Appearance, On click and Advanced. Click Apply to keep your changes in the draft, then save the dashboard with Done.
Comparison and Trend Line
A number’s Data tab sets what it is compared with and its line.
A dashboard created on the year, quarter or month so far compares with Same period last year; any other compares with the Previous period.
On a period that is not over yet, the change covers its days so far.
Trend interval (Daily, Weekly, Monthly, Quarterly, Yearly) is a preference. When it gives too few or too many points, the line takes the nearest interval that fits and says which.
A number card that counts or adds up, with a comparison, offers viewers What changed?. See What Changed?.
Which Way Is Good
On a number’s , Which way is good colors its change:
Higher is better: A rise is green, for sales and invoicing.
Lower is better: A rise is red, for costs, refunds or delays.
No judgment: Gray, for counts of open work.
Targets
On the Data tab, Show a target pins a published target to the number. The card then shows Target met or Target not met. See Targets.
Card Color
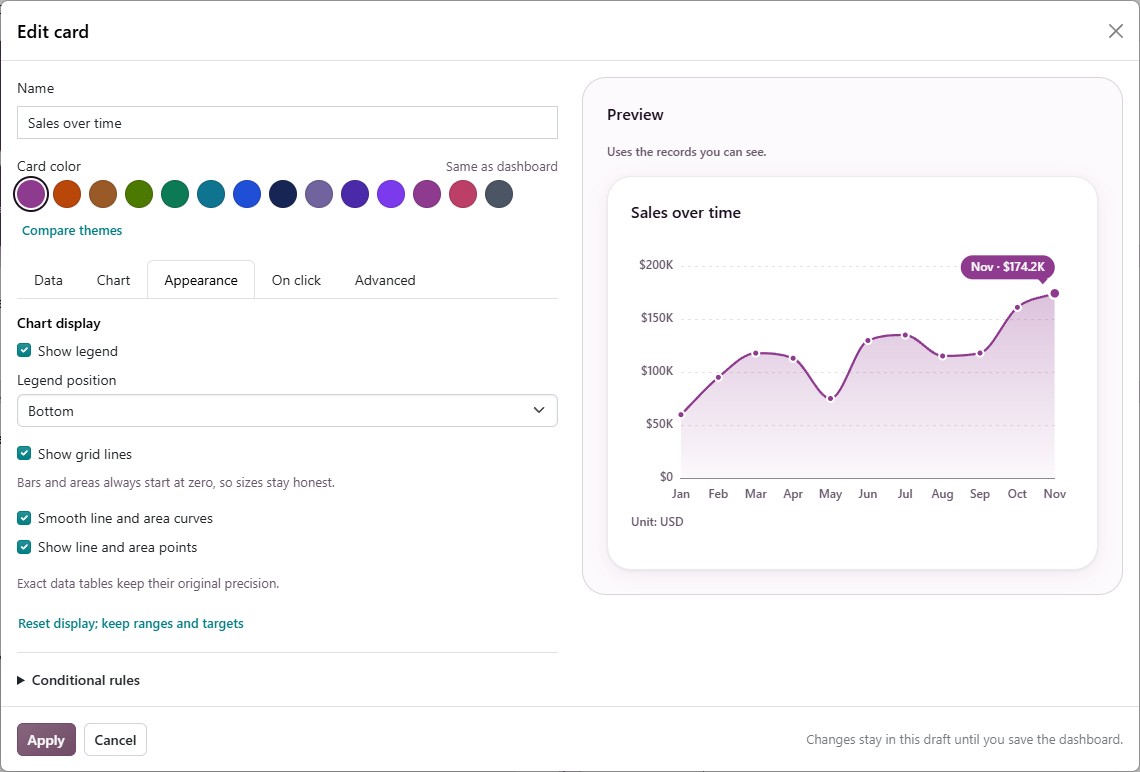
A card’s color is the Card color row of dots under its name.
Same as dashboard comes first and follows the dashboard when its theme changes.
Compare themes beside the dots shows every theme as a small chart sample.
On a big-number card the theme’s accent is the fill; on a chart it also sets the chart’s colors.
Values and Number Style
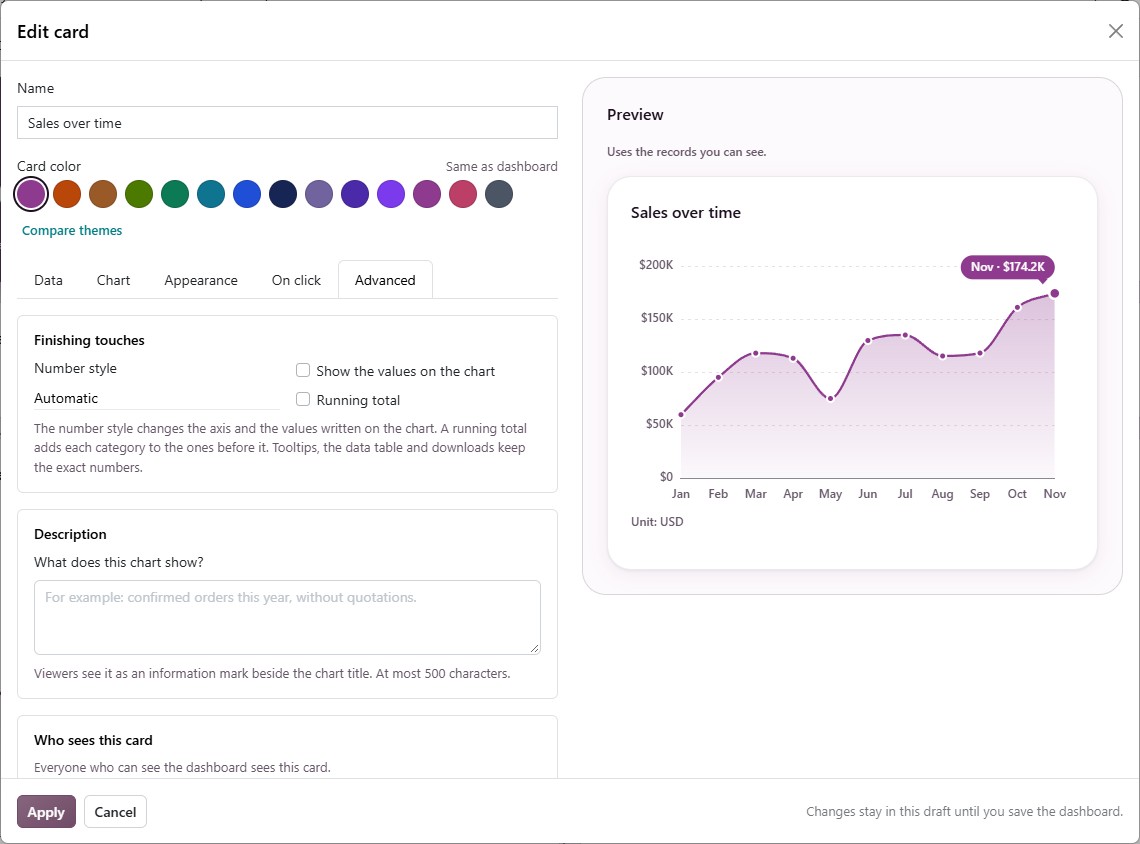
On a chart’s Advanced tab, Finishing touches offers:
Show the values on the chart: Writes each value on its bar, point or slice. A label that would overlap the one before it is left out.
Number style: Automatic, Short (1.2K, 3.4M), Lakh and crore (12L, 1.2Cr) or Full numbers (1,250,000). Tooltips, the data table and downloads keep the exact numbers.
Running total: Draws each category as itself plus the ones before it, such as sales added up month by month.
A number card has the same Number style on its Advanced tab.
What a Click Does
By default a click on a bar, slice, point or country opens its records (Open the records). Choose Filter this dashboard and a dashboard filter that fits the chart, and a click offers viewers both: the records and Focus the dashboard on the value. Every chart split one way also offers viewers Break down by › with no setup. See Focus and Break Down Bars.
A chart of a ready-made measure, or one that shows a running total, has no records behind each bar: its click does Nothing.
Description and Headlines
Description (on the Advanced tab, up to 500 characters): Viewers see it as an information mark beside the card title.
Headlines: Each chart and list writes its own one-line headline from its numbers. A split chart needs a count or total, at least three groups and a clear leader. A list needs to be sorted by its due date, earliest first. Set Which way is good on number cards so the dashboard’s summary line reads their changes as good or bad news.
Record Lists
Each column says what kind it is, such as Text, Money, Date or Related record.
Sort rows by chooses which records the card shows first: Odoo’s usual order, or one of its columns either way, such as Expected Closing · earliest first.
A column that shows a person draws a round picture beside the name, with initials when no picture is available.
Who Sees This Card
On the Advanced tab, Who sees this card lets you choose user groups, people or both.
Leave both empty and everyone who sees the dashboard sees the card.
Choose some and only they receive the card. For everyone else it is withheld, not just hidden, and the cards below it move up so no gap is left.
The dashboard’s owner always sees every card. A copy of a card keeps its audience.
See also