
Dashboards & Pulse Reports
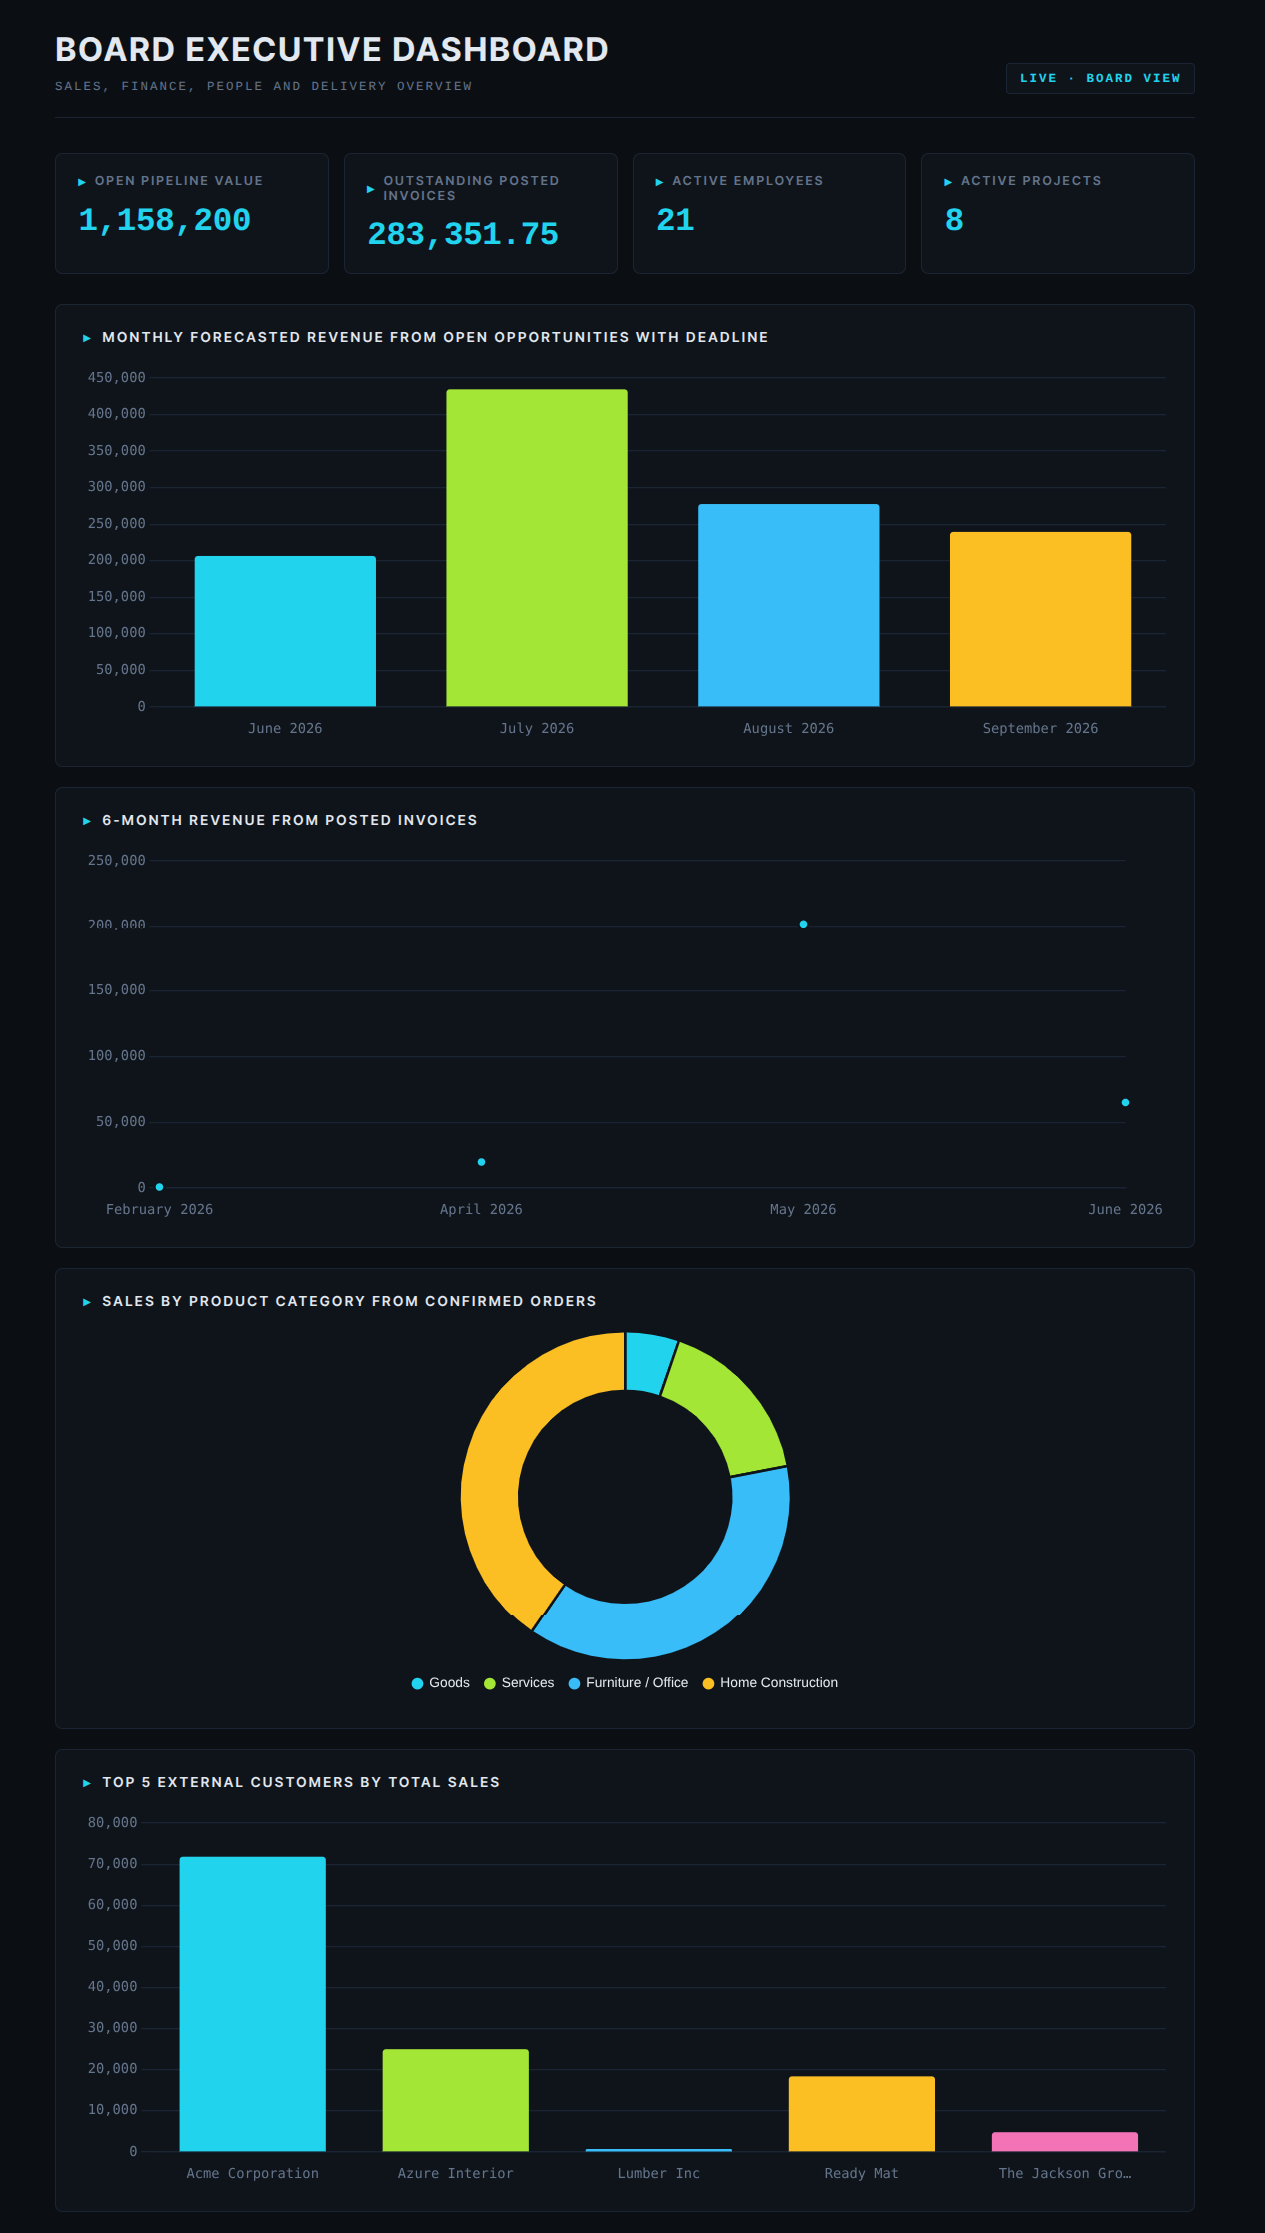
Beyond single charts, the MCP Server can compose full dashboards and run Pulse Reports, pre-built operational diagnostics. Both are produced by the AI on demand, both can be saved as Shared Pages, and both ship with a polished default theme.
Dashboards: compose_dashboard
When a user asks “build me a dashboard of last month’s sales”
or “give me a CRM overview”, the AI calls
compose_dashboard. The tool returns a self-contained
HTML artefact plus a recipe describing the dashboard’s
contents.
The default theme is Command: dark slate background, cyan accent, mono numbers, and Linear / Vercel-style polish. You can override the brand colours per recipe.
Sections
A dashboard recipe is a list of sections of one of four types:
kpi: a big number tile with optional sparkline and percent-change pill (when the AI passes a historical series).
kpi_row: a row of KPIs that automatically adapts its layout when there are more than four KPIs.
chart: a bar, line, or donut chart. The server applies smart defaults: date groupbys auto-become line charts, >8 categories auto-become horizontal bars.
table: a paged data table with a “Showing X of N” badge when the result exceeds the limit.
Two-step “save as page” flow
After compose_dashboard, the AI:
Renders the dashboard inline (artifact-capable clients like Claude.ai) or summarises it (clients without HTML artefacts like ChatGPT or Gemini CLI).
Asks the user explicitly: “Would you like to save this as a shareable Odoo URL?”
If yes, the AI calls save_dashboard_as_page with the
same recipe, and a Shared Page is created (see
Shared Pages).
The AI never saves silently. The user always confirms first.
Pulse Reports: pulse_report
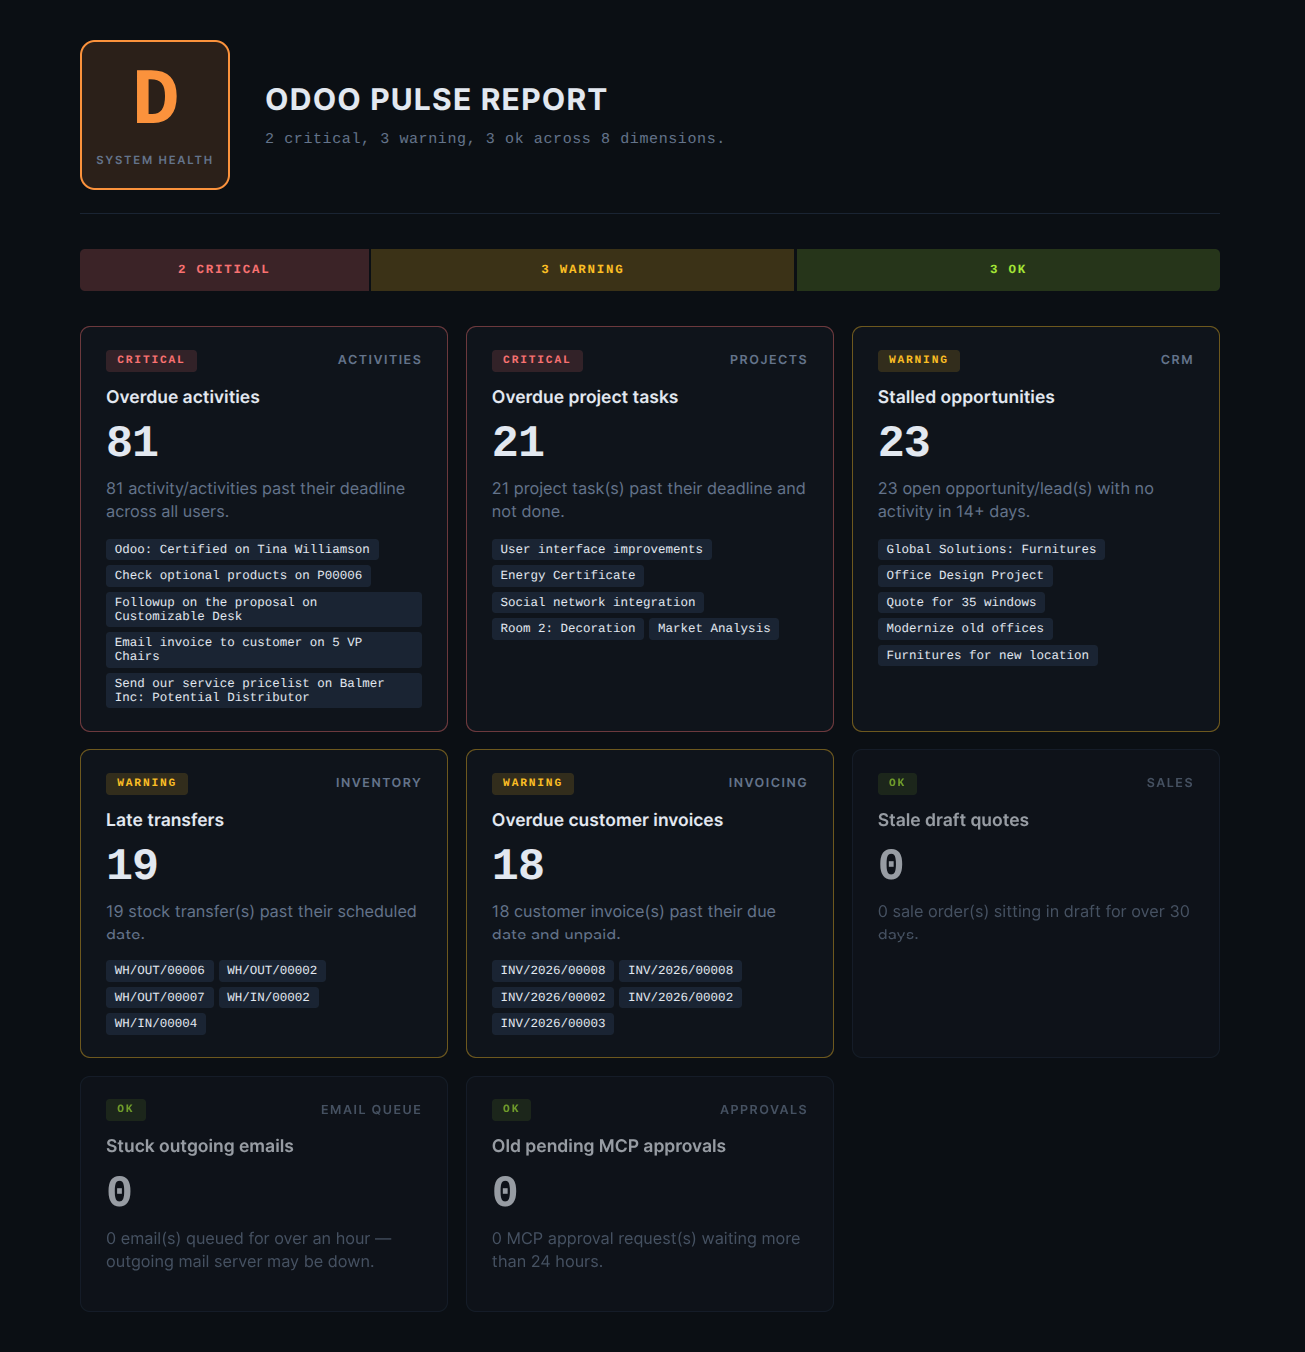
The Pulse Report is an operational health diagnostic the AI can run at any time. It scores up to eight dimensions A–F and renders a polished dashboard with red / amber / green finding cards.
The eight dimensions
Sales: stale draft quotes older than 30 days.
Invoicing: overdue unpaid invoices.
CRM: stalled opportunities with no activity for 14+ days.
Activities: overdue
mail.activityrecords.Email queue: stuck outgoing emails.
Approvals: MCP approval requests waiting more than 24h.
Inventory: late stock transfers.
Projects: overdue tasks.
Typical user prompts
“Run a system pulse report.”
“How are we doing on invoicing and CRM?” The AI passes
dimensions: ["Invoicing", "CRM"]so the report scopes to just those.“Anything stuck in the email queue?” Narrowed to one dimension.
Dimensions whose underlying Odoo module isn’t installed are silently skipped, with no error and no empty card.